Stephen Hicks | Seismologist
  • Home
  • Research
    • Imaging fluids in the Caribbean subduction zone
    • Mantle flow in a subduction zone
    • Structure of a subduction megathrust
    • Earthquake sources
    • Full waveform earthquake simulations
  • Communicating science
    • Journal Articles
    • Conference Presentations
    • In the Media
    • International Seismology Day
  • Blog: Tectonic Debates
  • Earthquake Resources
    • Animations
    • Recent Earthquake Teachable Moments
    • UK Moment Tensor Solutions >
      • M4.3 Jersey, Channel Islands - 11 July 2014
      • M4.1Bristol Channel - 20 Feb 2014
      • M4.2 Ramsgate, Kent - 22 May 2015
    • Technical notes
  • CV
  • Get In Touch

Earthquake sequence in Central Chile: what we know so far

25/4/2017

10 Comments

 
I was asked to provide some written comment to a Chilean newspaper, so I thought I'd take this opportunity to write a blog post about the current seismic events offshore of Valparaiso, Chile.

Seismic swarm

There was a clear sequence of seismic events that led up to last night's M6.9 earthquake.
 
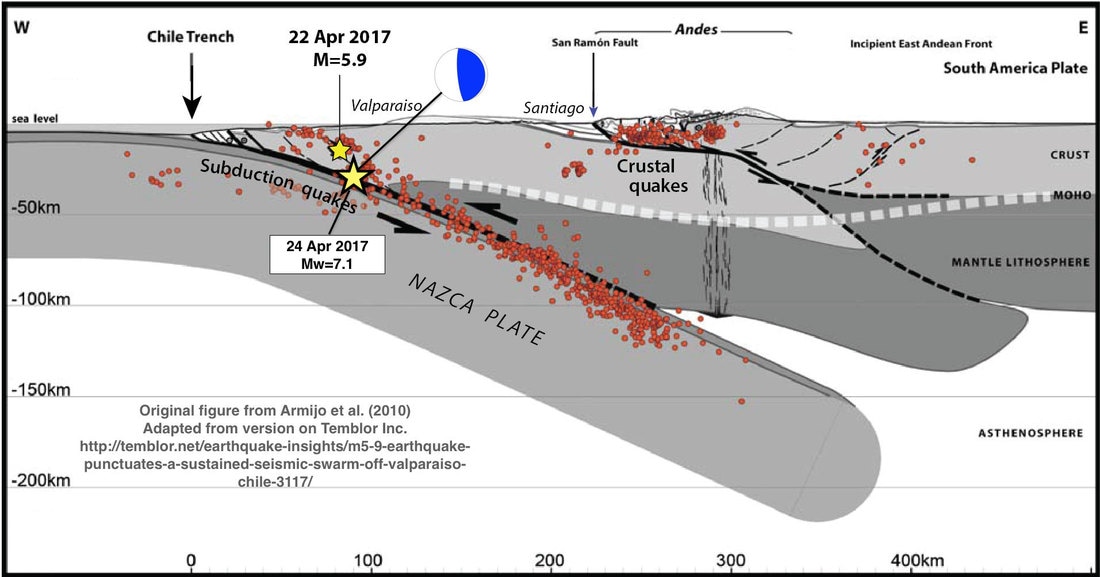
The first event of this seismic sequence occurred on 22 April with a magnitude 4.9 quake. The following day, there were many more small and moderate sized events, including a M5.9 quake. We call this sequence a seismic swarm because it contained many similar sized events occurring in the same location and within a short time of each other. There is some indication a number of these events may have occurred on splay faults that branch from the main subduction fault (see cross-section below).
Picture
Cross-section through the central Chile subduction zone. Red circles give the location of small past earthquakes. The yellow stars give the location of the 2017 foreshock and mainshock earthquakes. Original figure from Armijo et al. (2010).
Eventually, this swarm seems to have culminated (for now, at least) with the M6.9 earthquake that occurred yesterday evening; this is by far the strongest earthquake of the sequence so far. Preliminary data shows that this earthquake may have ruptured the megathrust plate boundary between the Nazca and South American plates. This type of faulting mechanism is responsible for some of the world's largest earthquakes.

Knowing what we do now, we can classify the earlier sequence as a 
foreshock swarm of the M6.9 earthquake. Naturally, this earthquake will have its own aftershock sequence. The largest aftershock so far has been a magnitude 5.4 earthquake that occurred just ~30 minutes after the mainshock. As part of ‘normal’ aftershock sequences, we can expect events as large as around 1 unit of magnitude less than the mainshock (i.e. M5.9-6). The most likely scenario for the near future is that the aftershock rate will gradually decrease with time. However, we cannot rule out the possibility of more, similarly strong, or even stronger events.

Historical precedence

The characteristics of this sequence are fairly similar to what occurred during the seismic sequence that led to the M8.2 Pisagua / Iquique earthquake in northern Chile in 2014. In the 2014 case, the foreshock sequence lasted weeks to months, whereas so far, it seems the Valparaiso sequence lasted a matter of just days. It is possible that this type of behaviour is somewhat characteristic of large earthquakes along the Chile subduction zone. Even the 1960 M9.5 Valdivia earthquake (the largest earthquake ever recorded) had large foreshocks that preceded it in the same area in the days before.

The last strong earthquake in the Valparaiso region occurred in 1985 (magnitude 7.8). Scientific studies have shown that this 1985 earthquake had its own intense foreshock sequence. Going back even further in time, earthquakes in this region typically occur every 75-90 years (see the graph to the right).
Picture
Past large earthquakes along the central Chile subduction zone. Original figure from Comte et al. (1985) and updated to include large ruptures since 1985. This figure shows that possible 'seismic gaps' still lie to the north and south of the April 2017 Valparaiso earthquake.
The April 2017 earthquake doesn’t seem to fit this apparently regular pattern. This discrepancy may be due to several factors: the low sample size of historical events, the little detail on magnitudes of ancient earthquakes, and a possible lack of data on moderate to large magnitude events that were of a similar size to yesterday’s quake.

Outlook

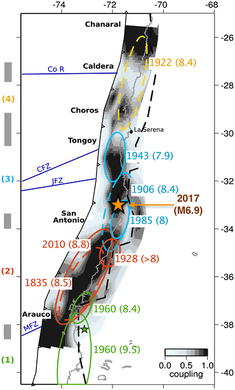
Overall, as yesterday’s event and the past history continues to tell us that the central Chile subduction plate boundary is very active and the region has a very high seismic hazard. We also know that the subduction megathrust fault offshore of Valparaiso is highly locked and may have the potential to host a M>7.5 earthquake in the future. There are still possible 'seismic gaps' to the north and south of the April 2017 Valparaiso earthquake. The map to the right shows the high degree of fault coupling in the area of the 2017 earthquake. 

​With the nearby population centres of Valparaiso and Santiago, earthquakes in this part of Chile have the potential to produce significant damage. 

​We can be sure though that our seismologist colleagues at the CSN (Centro Sismológico Nacional, Universidad de Chile) will be working very hard to inform the local public of any further developments in this current seismic sequence.
Picture
Distribution of fault coupling along the central Chile subduction zone. Darker shading indicates parts of the fault that are more strongly coupled. Map from Metois et al. (2012).
10 Comments

The bangs, crackles and hums of Earth's seismic orchestra

16/3/2017

0 Comments


Study gets to the bottom of ‘musical symphony’ produced in regions prone to mega-quakes as scientists work toward better quake hazard forecasting

You are at a classical music concert. There is an orchestra with three main sections. High up at the back, the percussion section has one very loud, large and moody-looking drum that gets struck very rarely. A handful of triangles produce occasional quieter “tings”. Further down, in the middle, there is a small band of violinists, but they are playing the strings so slowly the audience can barely hear them. Down at the front, a family of double bass instruments produces low-pitched, gentler hums from time to time.

​...

Read the full article here at The Guardian: 
https://www.theguardian.com/science/blog/2017/mar/15/the-bangs-crackles-and-hums-of-earths-seismic-orchestra
0 Comments

First results

23/9/2014

0 Comments

 
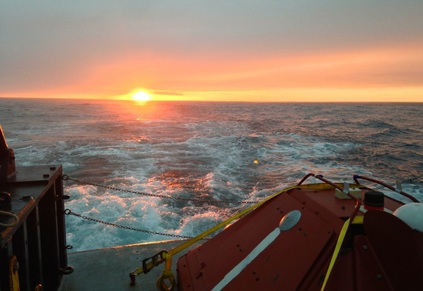
We now have deployed 23 and recovered 17 ocean bottom seismometers, leaving only three more to deploy and one to recover. This means we are due to finish two days earlier than planned (on schedule for arrival back into port on Wednesday evening). The weather has taken a slight turn for the worse again, and I have suffered from a couple bouts of seasickness. Fortunately, we have been blessed with amazing sunrises and sunsets.
Picture
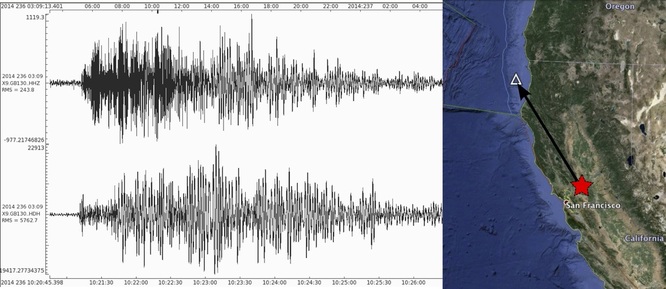
Now that we have recovered some seismometers, we have been able to look at some initial results from the 12 months that the seismometers have been at the seabed. We have been able to find some micro-earthquakes at the southern end of the Cascadia subduction zone. We also found that the seismometers were able to record the seismic waves from a damaging magnitude 6.0 earthquake that hit Napa, California on 24 August 2014. Our initial results show that the recording quality of the instruments is good and they will provide crucial information to unravel the character of the Cascadia megathrust fault and may provide an insight into the regional tectonic structure of the Western United States and Eastern Pacific rim.
Picture
The August 2014 M6 Napa earthquake (red star) recorded on an ocean-bottom seismometer in the southern Cascadia subduction zone (white triangle)

Video showing an OBS recovery

0 Comments

Working through the night

15/9/2014

0 Comments

 
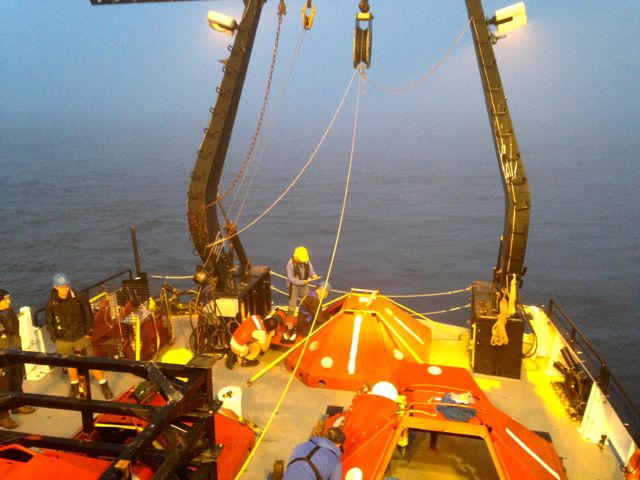
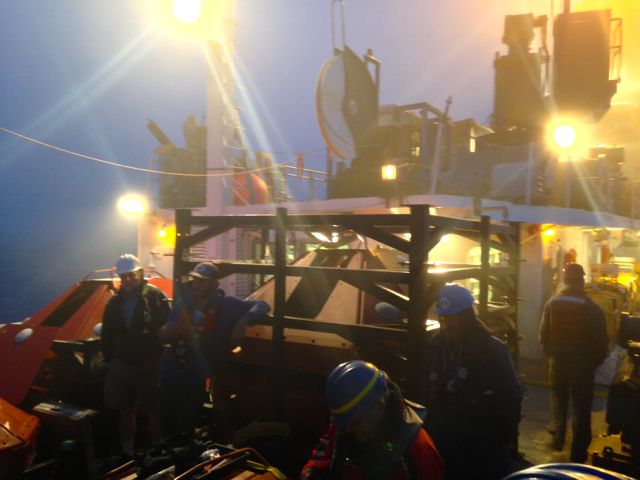
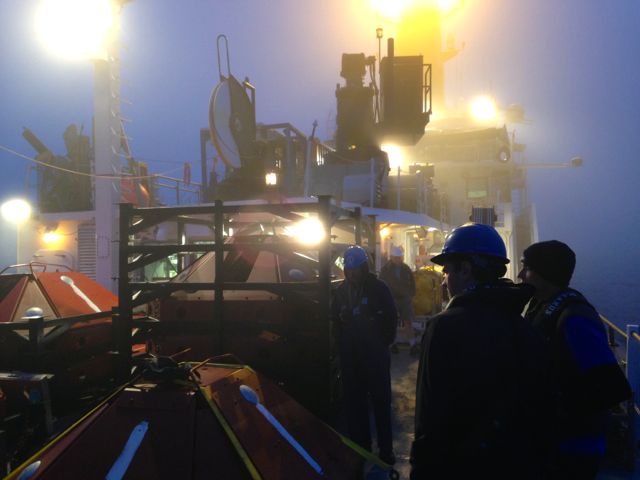
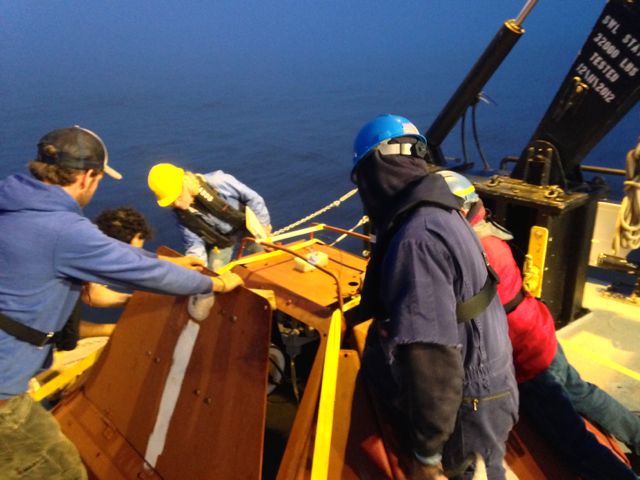
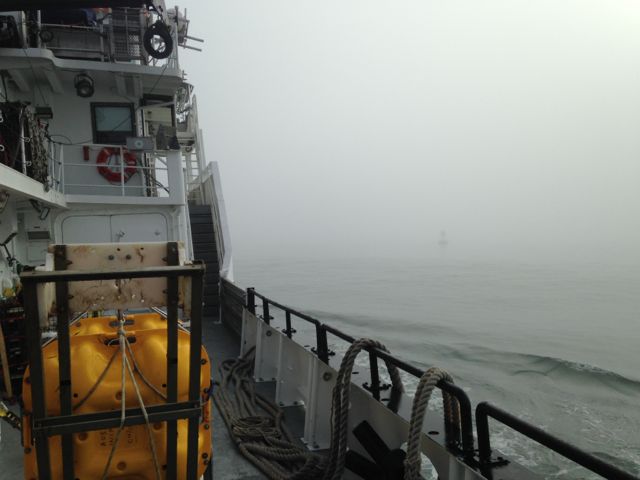
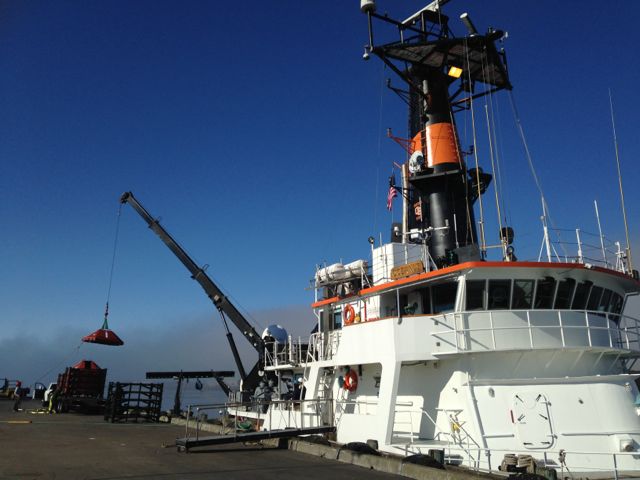
Ship time is expensive. Pots of money for scientific research are rarely bottomless. For us scientists, time on board is precious. To keep to schedule, we have been forced to work at all hours of the day. Each team of crew, technicians and scientists assigns watch duties to each member. Yesterday, I was lucky enough to have my watch in the early hours of the morning. The fog was thick and visibility minimal. Fortunately, the deck is well lit by floodlights. Here are several photos showing the atmospheric conditions we sometimes get on deck.
Picture
Picture
Picture
Picture
0 Comments

Quick update: Eureka, California

13/9/2014

0 Comments

 
Just a quick update as we've re-docked to pick up more gear for the next phase of the ocean-bottom seismometer deployment. As we arrived into the harbour, the fog was dense and visibility was minimal. There was a somewhat eerie feeling; buoys ringing in the distance and the ship's foghorn calling across the estuary.
Picture
Eerie arrival into fog-laden Eureka, California
Picture
The fog eventually cleared and we started to load more OBS equipment on deck
We have been temporarily blessed with fast internet, so I've been able to upload a video of one of our deployments from the past few days:
0 Comments

Taking the rough with the smooth

12/9/2014

0 Comments


Rough seas

Forgive me for the lack of blog posts over the past few days. Staring at a laptop screen for more than 5 minutes has not been easy.  The seas have been rough. Prior to coming to this trip, several of my friends scoffed at the idea of a ‘research cruise’. The experience so far has certainly been far removed from a traditional cruise, so I’d like to aptly rename this ‘research cruise’ as a ‘research trawl’. I have a new-found respect for all those that work at sea.

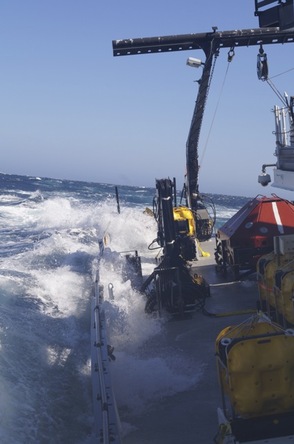
Yesterday, we were exposed to winds of more than 30 knots (35mph / 55 kph) and ocean swells of more than 10 ft. Our ship was tossed and turned as the waves passed through. We were forced to secure and tie-down all objects in the lab; it was hard to stay in our seats without sliding from one side of the boat to the other.  Unfortunately, during the rough seas, a handful of seismometer instruments, that were outside and secured to the deck, were damaged by waves. In total, 4 instruments were damaged, with two of them now with parts beyond repair. To put this damage into context, the total cost of an ocean-bottom seismometer is upwards of $32,000 (£20,000).
Picture
Getting overwhelmed by waves in the Pacific. Photo: Magali Barba
Picture
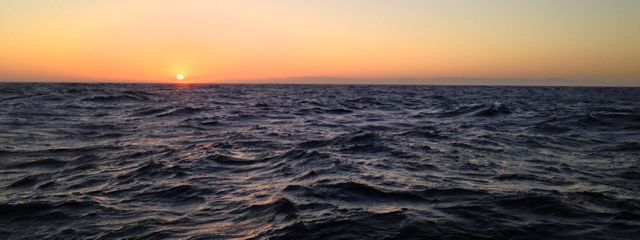
Catching the sun rise over the Oregon coast
Picture
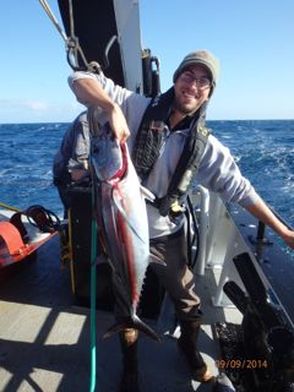
Alex with his catch of the day

Smooth sailing

Nevertheless, our progress has been good and we are about to cross from the waters of Oregon to offshore California. By working through the night, often going out on the deck in the bad weather, we have just about managed to stay on schedule. So far, we have deployed 12 seismometers and recovered one. 

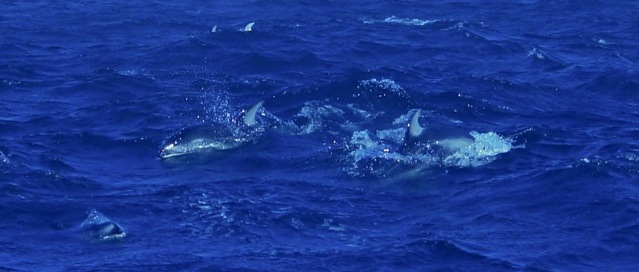
On the plus side, the weather today has been wonderful, with much calmer winds. We had a pod of dolphins (specifically, the Pacific White-Sided variety) swimming around the ship for several hours today. We also made use of some slow sailing time to go fishing. We caught several Pacific Albacore that will make for a great meal.

Tomorrow, we make for port in Eureka, northern California. This will be a very quick stop to collect some more equipment for the next stage of the deployment. Check out the map below showing our current progress.
Picture
Pod of Dolphins showing off their acrobatics. Photo: Magali Barba.

Current progress

Yellow circle = last recorded location

Green square = OBS station to deploy

Red square = OBS station to recover

Grey square = site completed

0 Comments

First night on board

7/9/2014

1 Comment

 
Picture
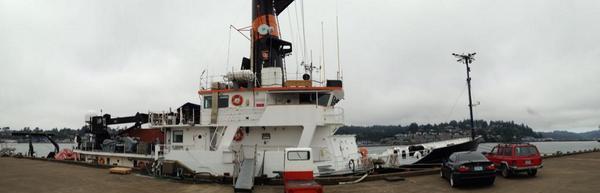
Home for the next 3 weeks - R/V Oceanus. Cars for scale.
We are docked at Newport, a fishing city on the west coast of Oregon. Newport is the home of the US Government's Pacific Marine Operations Center. It is also home to Oregon State University's flagship ship, R/V Oceanus. 

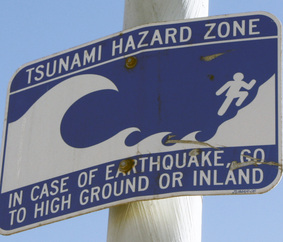
As we arrived downtown, I was told a key piece of information by Alex, a grad student from Oregon State University who is also on this cruise and knows the area well. Pointing, he says "If an earthquake happens, run for that hill there". Road signs provide a clear indication of why. I've been to a tsunami danger zone before, in central Chile, but there, the large earthquake had happened and the probabilities of a big one occurring again were much smaller. Cascadia is different. As I said in my last post, a large earthquake is waiting to happen. It's a case of when - not if. Fortunately, we are at the forefront of research that is trying to understand the earthquake hazard.
Picture
There are plenty of warning signs in Newport

Being put to work

Picture
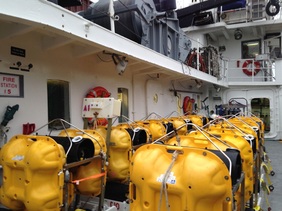
Ocean bottom seismometers have arrived on deck (the yellow boxes) - it's almost time to set sail
As soon as we got on board, we were put to work. There were a few brief handshakes, but it was clear that there was a lot to do before we set sail in the morning. The first job was to carry heavy pieces of vital equipment onto deck. I had arrived in my jeans and flip flops, which turned out to be highly unsuitable.Tomorrow, I will certainly wear my steel toe-capped wellies from the off. I am learning quickly.


Fortunately, all the equipment is on board and we are ready to set sail. As I look out to sea, the weather looks foggy. This is a good sign as fog normally means low winds and calm seas. Fingers crossed.I have no idea how I'm going to react to rough seas, so I've taken seasickness pills as a precaution. I have also stocked up on crystallised ginger, which is believed to be a great remedy for nausea.
There are several different teams on board. Of course, we have 15-strong ship's crew. They are all hugely friendly, and the cook is renowned across the marine geophysics community for whipping up some great meals. It is clear we are going to be well looked after. There is also a team of technicians fromLamont-Doherty Earth Observatory at Columbia University. These guys will be dealing with the technical aspects of ensuring that the ocean bottom seismometers are ready to be deployed. Finally, there are the scientists - that's us. There are 7 of us in total - all from the States, apart from me. I will introduce you some of my fellow hands in the next few posts.
Check out our progress. 
Yellow circle = current location
1 Comment

Seismology on the high seas

5/9/2014

0 Comments

 
In 1700, a magnitude 9 earthquake struck the northwest coast of America. Why did this earthquake happen? Could it happen again? When will the next one happen and how big will it be? To try and help answer some of these questions, I’m heading on a cruise in the Pacific Ocean to join a team of U.S. earth scientists working in the region.
Picture
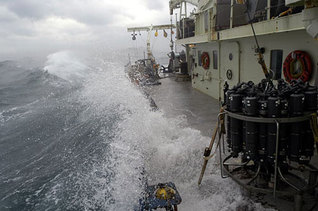
Resarch Vessel Oceanus getting battered by waves on a previous cruise. I'm really hoping we don't have stormy seas like this! Image credit: Oregon State University. Source: http://ceoas.oregonstate.edu/oceanus/
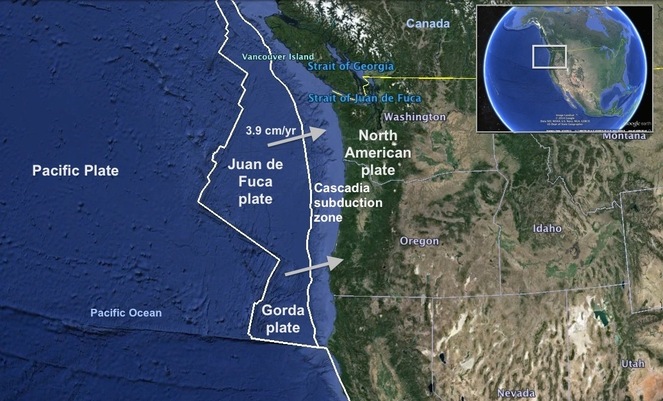
A 1000 km (630 mile) long geological fault lies off the west coast of North America. It runs from Cape Mendocino (northern California) in the south to Vancouver Island (Canada) in the north. This giant fracture draws the battle lines in a titanic struggle between two tectonic plates: one oceanic; the other continental. North America wins the battle as the oceanic Juan de Fuca plate slowly sinks into Earth’s mantle. We call this collision and sinking of plates subduction.

A major battle line in Earth’s crust

The Cascadia subduction zone is not alone. Subduction takes place all around the Pacific Rim. Along shallow parts of these slanting subduction faults, friction between the two plates is high. The locking together of these two plates and the  builds up of stress along the fault for over hundreds of years. Eventually, the stress becomes too large and the fault suddenly unzips - a giant megathrust earthquake. Megathrust earthquakes can often exceed magnitude 8, which is why subduction zones are highly hazardous. Because these faults tend to lie beneath the oceans, they can cause large, damaging tsunamis. Since the last decade, large megathrust earthquakes in Indonesia (2004), Chile (2010) and Japan (2011) and associated tsunamis have reminded us of their destructive power.
Picture
Plate tectonics along the Pacific Northwest region of North America
The last known great earthquake to hit the northwest coast of America was in 1700 - some 300 years ago. Evidence suggests that these type of earthquakes have taken place seven times in the past 3,500 years. This history indicates that earthquakes along the Cascadia margin tend to occur every 400­–600 years. The Cascadia subduction zone has been eerily quiet for a while – this could suggest that stress is building along the fault and the two plates may be almost fully locked against each other. Based on historical data, there is nearly a 40% chance of a major earthquake occurring in this region within the next 50 years.

Listening to crackles on the seabed

With large centers of population in the Pacific northwest living close to the coast  – cities such as Seattle and Portland -  authorities aren’t taking any chances. The US government has funded a large-scale geophysical experiment to monitor and understand seismic hazard in Cascadia. The $10m Cascadia Initiative aims to deploy GPS and seismic stations to monitor any changes in movement along the fault. The findings from this research will help to understand the frictional properties of the megathrust fault, crucial to understand how and why it may host future large earthquakes.

Over the next three weeks, I’ll be taking to the seas offshore of Oregon and California on Research Vessel Oceanus to collect seismometers that have been lying at the seabed for many months. These highly sensitive instruments will record any small vibrations in the ground caused by earthquakes. We hope to make some preliminary measurements from the recorded data to try and the nature of earthquakes in the region. Understanding the small earthquakes may be key to understanding the big one that happens in the future. We will also deploy further seismometers on the seabed. I’ll be part of a team led by Chief Scientists Anne Trehu from Oregon State University and Dean Livelybrooks from the University of Oregon.  In total, over the three weeks, we have 45 ocean bottom seismometers to deploy and decommission, so we going to be working around the clock to stick to schedule.
Picture
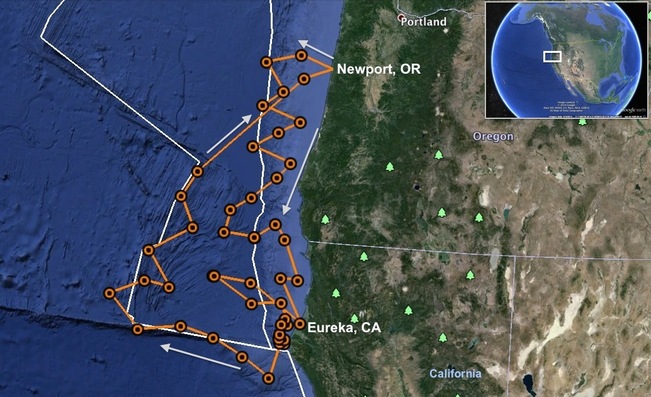
Map showing our cruise plan. The orange and black circles are ocean bottom seismometer sites that need to have instruments deployed / decommissioned. Our deepest ocean seismometer will be placed some 4000 m (1300 ft) below sea level and our furthest seismometer lies 350 km (220 mi) from the nearest piece of coastline.
I would be lying if I said I wasn't nervous. I have very little experiencing of travelling at sea, let alone working at sea. Seasickness could be a huge concern for me. This trip will be a big challenge and I'm sure there'll be some hiccups along the way. Nevertheless, it will be a great experience and a good chance to learn a new method of studying earthquakes.

I will try to keep you informed of our progress by using this blog and Google Maps I will also be regularly posting mini-updates to Twitter.
0 Comments

    Tectonic Debates


    About

    This blog focusses on a wide range of aspects in earthquake science including earth structure, induced seismicity and hazard communication.

    Archives

    April 2017
    March 2017
    September 2014
    April 2014
    February 2014

    Categories

    All
    Africa
    Botswana
    Cascadia
    Cascadia Initiative
    Doublet
    Earthquake
    Earthquake Early Warning
    Earthquakes
    Episodic Tremor And Slip
    ETS
    Japan
    Kaikoura
    Mexico
    New Zealand
    Ocean Bottom Seismometer
    Pacific Northwest
    Philippines
    Science Communication
    Seismic Hazard
    Slow Slip Events
    Tsunami

    RSS Feed

Powered by Create your own unique website with customizable templates.