Stephen Hicks | Seismologist
  • Home
  • Research
    • Imaging fluids in the Caribbean subduction zone
    • Mantle flow in a subduction zone
    • Structure of a subduction megathrust
    • Earthquake sources
    • Full waveform earthquake simulations
  • Communicating science
    • Journal Articles
    • Conference Presentations
    • In the Media
    • International Seismology Day
  • Blog: Tectonic Debates
  • Earthquake Resources
    • Animations
    • Recent Earthquake Teachable Moments
    • UK Moment Tensor Solutions >
      • M4.3 Jersey, Channel Islands - 11 July 2014
      • M4.1Bristol Channel - 20 Feb 2014
      • M4.2 Ramsgate, Kent - 22 May 2015
    • Technical notes
  • CV
  • Get In Touch

March 27th, 2017

27/3/2017

0 Comments


New Zealand quake study reveals ruptures can be much bigger than we thought possible

Image 20170324 12136 jfqite
Shutterstock
Stephen Hicks, University of Southampton

No one could have expected what was to hit New Zealand in 2016. The country is certainly no stranger to being shaken up by moving tectonic plates. Yet on November 14 2016, it was struck by what may be the most complex rupture ever recorded, overshadowing even the highly destructive sequence of earthquakes that hit Christchurch in 2010 and 2011. New research into the event shows we may have to rethink our understanding of how far earthquake ruptures can travel. The Conversation

Around midnight, without warning, a magnitude 7.8 earthquake ripped through the country’s South Island, with the main rupture lying close to the coastal town of Kaikoura. As the rupture advanced to the north-east, it left a trail of devastation.

Submerged rocky plateaus beneath the coast rose up from the ocean and became new reefs, suddenly releasing thousands of tonnes of gushing seawater. This deafening cascade lasted minutes. Houses were sheared from their foundations and deposited into adjacent fields. Railway lines were dragged from their beds and re-routed.
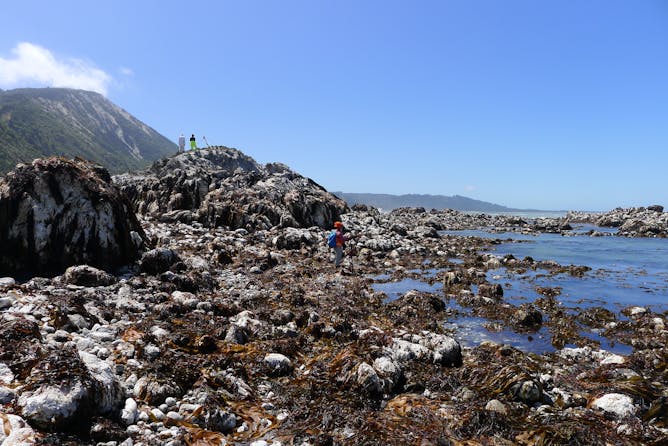
Brand new land suddenly formed along coastlines. Dr Kate Clark / GNS Science

Tens of thousands of landslides roared down slopes as mountains, hills, and cliffs could not stand up to the shaking. Huge volumes of mud, sand, and gravel rushed onto the abyssal plains of the Pacific Ocean. Within minutes, a three-metre-high tsunami inundated local coastlines. Two people were killed, although far more deaths could have been expected for an event of this size. This earthquake had everything.

New research, published in the journal Science, used evidence from satellites, ground sensors and field maps to show that the 2016 quake ruptured at least 12 major fault-lines. Like dominoes tumbling and crashing against each other, each fault unzipped and shifted blocks of the crust by more than 20 metres, the height of a four-storey building. Many quake records also tumbled. Never before has such a cascading rupture across so many faults been observed in such detail.

Dr Ian Hamling, the lead author on the study, is an earthquake scientist based at GNS Science in New Zealand. Based in nearby Wellington, Hamling experienced the shaking. “I’ve lived in New Zealand for four years and have felt a few earthquakes,” he told me. “I didn’t expect this one to be as complex as it was.” Within hours, the data coming into GNS told a unique story, leaving Hamling “stunned”.

Railway and road destruction. Dr Kate Clark / GNS Science

For earthquake scientists around the globe, the events of New Zealand raise key questions. How often does this type of quake occur and could it happen elsewhere?

The geology of this part of New Zealand is a labyrinth. It is the pivot point between two plate boundaries. To the north, one tectonic plate dives beneath the other. Further south, two plates slide alongside each other, forming the country’s Southern Alps. As a result, the crust in the Kaikoura region is highly broken up and fractured. Similar mazes of fractured rock can be found in many of the world’s earthquake-prone regions.

For areas around the world that host large earthquakes, scientists use a model they call “segmentation”. Segments are discrete areas of faults, tens to hundreds of kilometres long, that typically rupture on their own during large quakes. This concept comes from recent recordings of seismic shocks and descriptions of ancient quakes in historical records.

Satellite radar data of the quake – each coloured fringe represents around 12 cm of ground movement. Satellite data source: Geospatial Information Authority of Japan

When excavating evidence left by past earthquakes, scientists have often assumed geological scars running across multiple segments were caused by separate events. The new research into the 2016 quake shows that a single rupture can even jump across large gaps between segments, which do not necessarily need a clear physical connection.

With advances in satellite imaging, scientists are now able to dissect complex quakes. The New Zealand quake occurred partly on land, where it could be easily monitored. Satellites were poised to detect tiny changes in ground movement, networks of monitoring instruments were in place, and dedicated teams were rapidly deployed to map out the plethora of faults. In this case, the complexity of the rupture was clear.

But what if an earthquake were to strike in the remotest parts of the planet, such as in the deserts of central Asia, or below the deepest oceans? In isolated areas, complex events may remain undetected and could occur more often than previously assumed.

Dark rocks rise from the sea. Tonkin + Taylor, NZ (Environmental and Engineering Consultancy)

Maps showing the estimated hazard posed by quakes in different regions are generally based on the assumption of single segment ruptures. In earthquake scenarios where fault segments link up, there is a bigger area available to rupture, ramping up the quake’s energy. Magnitude seven quakes become magnitude eight; eights become nines. Hamling said: “This event will definitely start to feed into our hazard models.” New Zealand is now showing the world that calculations of earthquake hazard need a rethink.

These lessons will also affect early-warning systems for earthquakes. These systems rapidly assess the first few seconds of an incoming seismic signal to estimate the degree of shaking when potentially damaging waves arrive. Initial seismic waves during the Kaikoura earthquake probably gave no indication that the quake could develop into a magnitude 7.8 rupture due to the domino effect. So understanding the cascading process during the New Zealand rupture could improve our abilities to warn whether a quake is destined for “greatness”.

The Kaikoura quake will likely remain unparalleled for some time. Yet as our models better simulate the true complexity of Earth and new observations illuminate hidden parts of the planet, we may find that the 2016 events and the wisdom gained could be overshadowed in the not so distant future.

Stephen Hicks, Postdoctoral Research Fellow in Seismology, University of Southampton

This article was originally published on The Conversation. Read the original article.
0 Comments

First results

23/9/2014

0 Comments

 
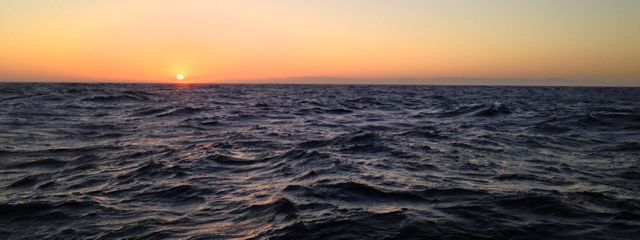
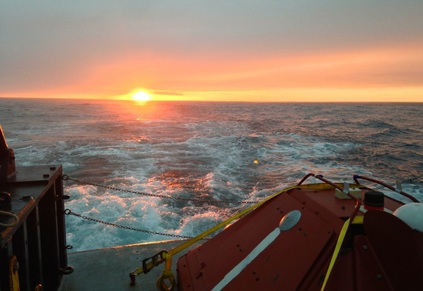
We now have deployed 23 and recovered 17 ocean bottom seismometers, leaving only three more to deploy and one to recover. This means we are due to finish two days earlier than planned (on schedule for arrival back into port on Wednesday evening). The weather has taken a slight turn for the worse again, and I have suffered from a couple bouts of seasickness. Fortunately, we have been blessed with amazing sunrises and sunsets.
Picture
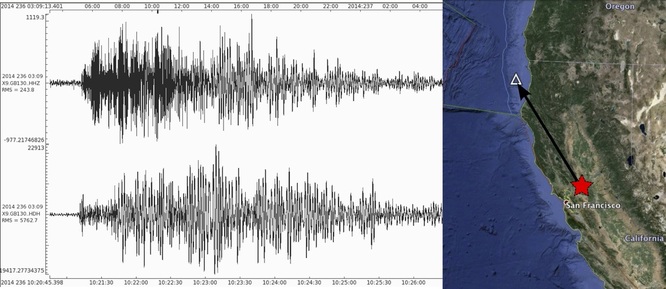
Now that we have recovered some seismometers, we have been able to look at some initial results from the 12 months that the seismometers have been at the seabed. We have been able to find some micro-earthquakes at the southern end of the Cascadia subduction zone. We also found that the seismometers were able to record the seismic waves from a damaging magnitude 6.0 earthquake that hit Napa, California on 24 August 2014. Our initial results show that the recording quality of the instruments is good and they will provide crucial information to unravel the character of the Cascadia megathrust fault and may provide an insight into the regional tectonic structure of the Western United States and Eastern Pacific rim.
Picture
The August 2014 M6 Napa earthquake (red star) recorded on an ocean-bottom seismometer in the southern Cascadia subduction zone (white triangle)

Video showing an OBS recovery

0 Comments

Working through the night

15/9/2014

0 Comments

 
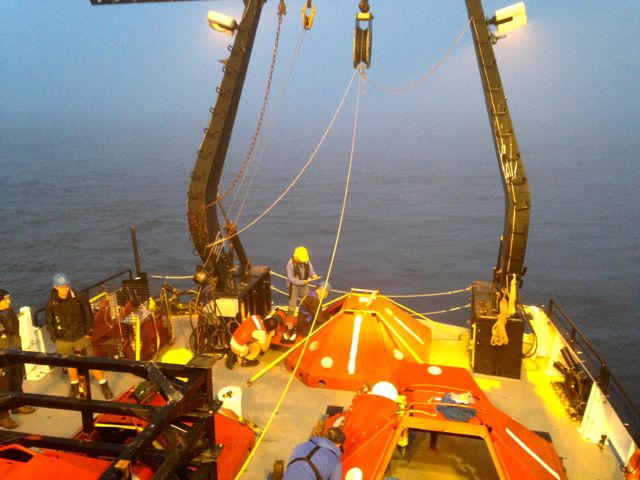
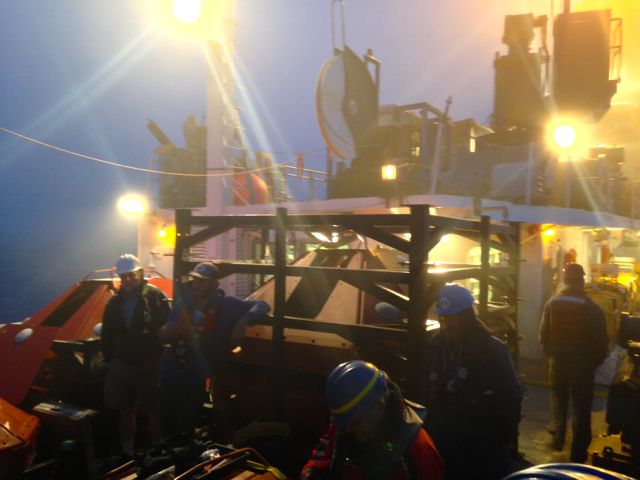
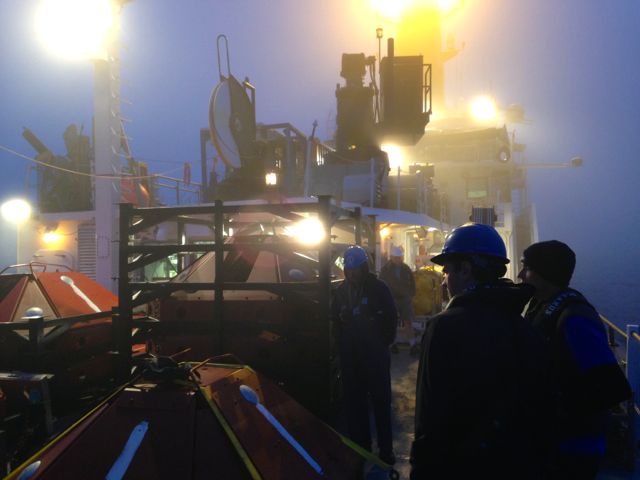
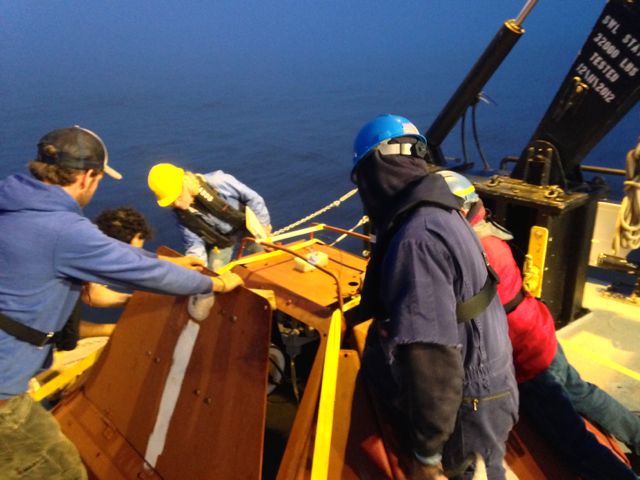
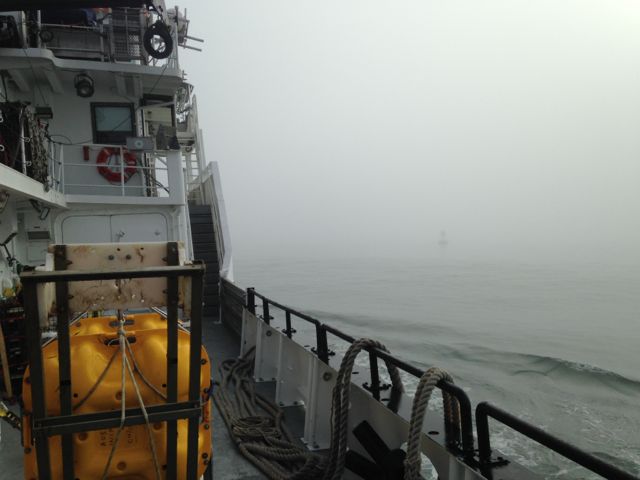
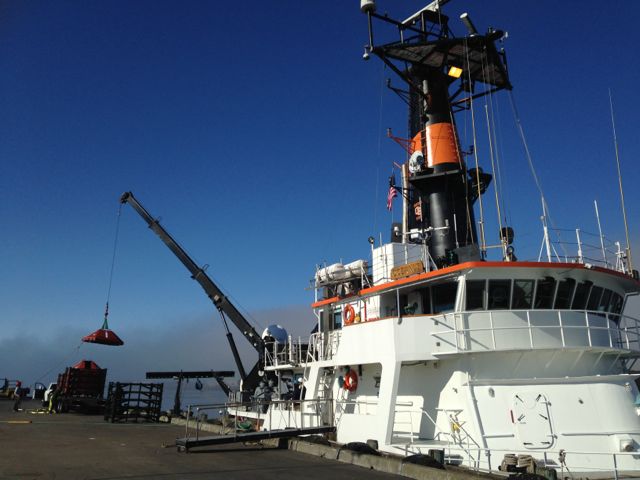
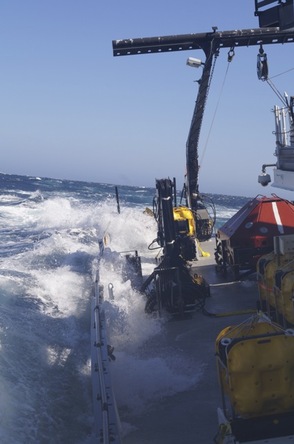
Ship time is expensive. Pots of money for scientific research are rarely bottomless. For us scientists, time on board is precious. To keep to schedule, we have been forced to work at all hours of the day. Each team of crew, technicians and scientists assigns watch duties to each member. Yesterday, I was lucky enough to have my watch in the early hours of the morning. The fog was thick and visibility minimal. Fortunately, the deck is well lit by floodlights. Here are several photos showing the atmospheric conditions we sometimes get on deck.
Picture
Picture
Picture
Picture
0 Comments

Quick update: Eureka, California

13/9/2014

0 Comments

 
Just a quick update as we've re-docked to pick up more gear for the next phase of the ocean-bottom seismometer deployment. As we arrived into the harbour, the fog was dense and visibility was minimal. There was a somewhat eerie feeling; buoys ringing in the distance and the ship's foghorn calling across the estuary.
Picture
Eerie arrival into fog-laden Eureka, California
Picture
The fog eventually cleared and we started to load more OBS equipment on deck
We have been temporarily blessed with fast internet, so I've been able to upload a video of one of our deployments from the past few days:
0 Comments

Taking the rough with the smooth

12/9/2014

0 Comments


Rough seas

Forgive me for the lack of blog posts over the past few days. Staring at a laptop screen for more than 5 minutes has not been easy.  The seas have been rough. Prior to coming to this trip, several of my friends scoffed at the idea of a ‘research cruise’. The experience so far has certainly been far removed from a traditional cruise, so I’d like to aptly rename this ‘research cruise’ as a ‘research trawl’. I have a new-found respect for all those that work at sea.

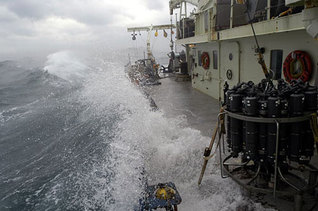
Yesterday, we were exposed to winds of more than 30 knots (35mph / 55 kph) and ocean swells of more than 10 ft. Our ship was tossed and turned as the waves passed through. We were forced to secure and tie-down all objects in the lab; it was hard to stay in our seats without sliding from one side of the boat to the other.  Unfortunately, during the rough seas, a handful of seismometer instruments, that were outside and secured to the deck, were damaged by waves. In total, 4 instruments were damaged, with two of them now with parts beyond repair. To put this damage into context, the total cost of an ocean-bottom seismometer is upwards of $32,000 (£20,000).
Picture
Getting overwhelmed by waves in the Pacific. Photo: Magali Barba
Picture
Catching the sun rise over the Oregon coast
Picture
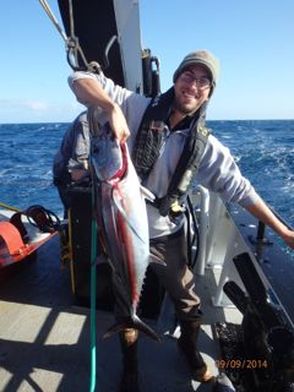
Alex with his catch of the day

Smooth sailing

Nevertheless, our progress has been good and we are about to cross from the waters of Oregon to offshore California. By working through the night, often going out on the deck in the bad weather, we have just about managed to stay on schedule. So far, we have deployed 12 seismometers and recovered one. 

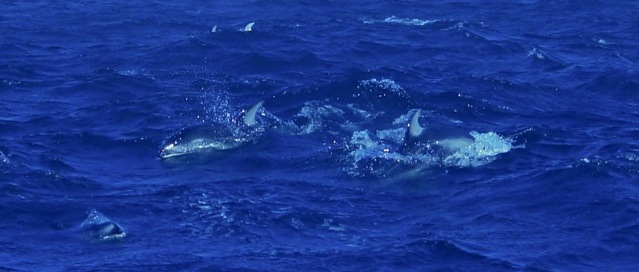
On the plus side, the weather today has been wonderful, with much calmer winds. We had a pod of dolphins (specifically, the Pacific White-Sided variety) swimming around the ship for several hours today. We also made use of some slow sailing time to go fishing. We caught several Pacific Albacore that will make for a great meal.

Tomorrow, we make for port in Eureka, northern California. This will be a very quick stop to collect some more equipment for the next stage of the deployment. Check out the map below showing our current progress.
Picture
Pod of Dolphins showing off their acrobatics. Photo: Magali Barba.

Current progress

Yellow circle = last recorded location

Green square = OBS station to deploy

Red square = OBS station to recover

Grey square = site completed

0 Comments

First night on board

7/9/2014

1 Comment

 
Picture
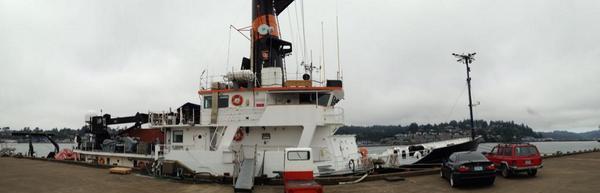
Home for the next 3 weeks - R/V Oceanus. Cars for scale.
We are docked at Newport, a fishing city on the west coast of Oregon. Newport is the home of the US Government's Pacific Marine Operations Center. It is also home to Oregon State University's flagship ship, R/V Oceanus. 

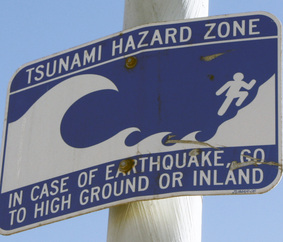
As we arrived downtown, I was told a key piece of information by Alex, a grad student from Oregon State University who is also on this cruise and knows the area well. Pointing, he says "If an earthquake happens, run for that hill there". Road signs provide a clear indication of why. I've been to a tsunami danger zone before, in central Chile, but there, the large earthquake had happened and the probabilities of a big one occurring again were much smaller. Cascadia is different. As I said in my last post, a large earthquake is waiting to happen. It's a case of when - not if. Fortunately, we are at the forefront of research that is trying to understand the earthquake hazard.
Picture
There are plenty of warning signs in Newport

Being put to work

Picture
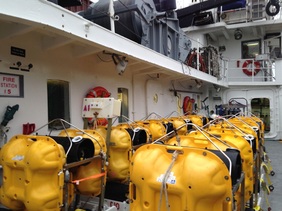
Ocean bottom seismometers have arrived on deck (the yellow boxes) - it's almost time to set sail
As soon as we got on board, we were put to work. There were a few brief handshakes, but it was clear that there was a lot to do before we set sail in the morning. The first job was to carry heavy pieces of vital equipment onto deck. I had arrived in my jeans and flip flops, which turned out to be highly unsuitable.Tomorrow, I will certainly wear my steel toe-capped wellies from the off. I am learning quickly.


Fortunately, all the equipment is on board and we are ready to set sail. As I look out to sea, the weather looks foggy. This is a good sign as fog normally means low winds and calm seas. Fingers crossed.I have no idea how I'm going to react to rough seas, so I've taken seasickness pills as a precaution. I have also stocked up on crystallised ginger, which is believed to be a great remedy for nausea.
There are several different teams on board. Of course, we have 15-strong ship's crew. They are all hugely friendly, and the cook is renowned across the marine geophysics community for whipping up some great meals. It is clear we are going to be well looked after. There is also a team of technicians fromLamont-Doherty Earth Observatory at Columbia University. These guys will be dealing with the technical aspects of ensuring that the ocean bottom seismometers are ready to be deployed. Finally, there are the scientists - that's us. There are 7 of us in total - all from the States, apart from me. I will introduce you some of my fellow hands in the next few posts.
Check out our progress. 
Yellow circle = current location
1 Comment

Seismology on the high seas

5/9/2014

0 Comments

 
In 1700, a magnitude 9 earthquake struck the northwest coast of America. Why did this earthquake happen? Could it happen again? When will the next one happen and how big will it be? To try and help answer some of these questions, I’m heading on a cruise in the Pacific Ocean to join a team of U.S. earth scientists working in the region.
Picture
Resarch Vessel Oceanus getting battered by waves on a previous cruise. I'm really hoping we don't have stormy seas like this! Image credit: Oregon State University. Source: http://ceoas.oregonstate.edu/oceanus/
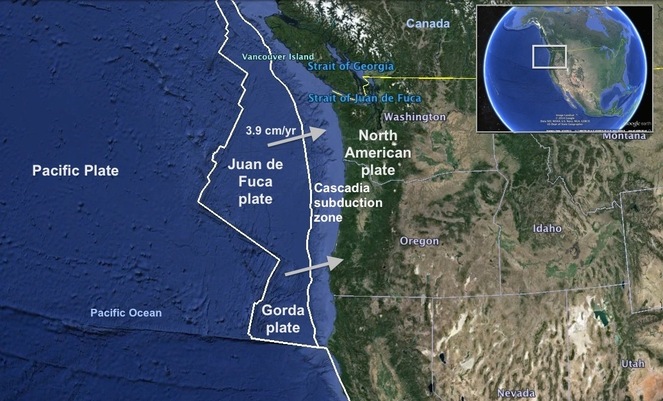
A 1000 km (630 mile) long geological fault lies off the west coast of North America. It runs from Cape Mendocino (northern California) in the south to Vancouver Island (Canada) in the north. This giant fracture draws the battle lines in a titanic struggle between two tectonic plates: one oceanic; the other continental. North America wins the battle as the oceanic Juan de Fuca plate slowly sinks into Earth’s mantle. We call this collision and sinking of plates subduction.

A major battle line in Earth’s crust

The Cascadia subduction zone is not alone. Subduction takes place all around the Pacific Rim. Along shallow parts of these slanting subduction faults, friction between the two plates is high. The locking together of these two plates and the  builds up of stress along the fault for over hundreds of years. Eventually, the stress becomes too large and the fault suddenly unzips - a giant megathrust earthquake. Megathrust earthquakes can often exceed magnitude 8, which is why subduction zones are highly hazardous. Because these faults tend to lie beneath the oceans, they can cause large, damaging tsunamis. Since the last decade, large megathrust earthquakes in Indonesia (2004), Chile (2010) and Japan (2011) and associated tsunamis have reminded us of their destructive power.
Picture
Plate tectonics along the Pacific Northwest region of North America
The last known great earthquake to hit the northwest coast of America was in 1700 - some 300 years ago. Evidence suggests that these type of earthquakes have taken place seven times in the past 3,500 years. This history indicates that earthquakes along the Cascadia margin tend to occur every 400­–600 years. The Cascadia subduction zone has been eerily quiet for a while – this could suggest that stress is building along the fault and the two plates may be almost fully locked against each other. Based on historical data, there is nearly a 40% chance of a major earthquake occurring in this region within the next 50 years.

Listening to crackles on the seabed

With large centers of population in the Pacific northwest living close to the coast  – cities such as Seattle and Portland -  authorities aren’t taking any chances. The US government has funded a large-scale geophysical experiment to monitor and understand seismic hazard in Cascadia. The $10m Cascadia Initiative aims to deploy GPS and seismic stations to monitor any changes in movement along the fault. The findings from this research will help to understand the frictional properties of the megathrust fault, crucial to understand how and why it may host future large earthquakes.

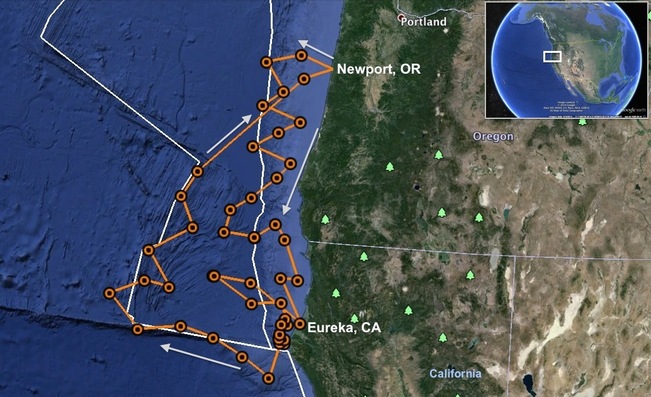
Over the next three weeks, I’ll be taking to the seas offshore of Oregon and California on Research Vessel Oceanus to collect seismometers that have been lying at the seabed for many months. These highly sensitive instruments will record any small vibrations in the ground caused by earthquakes. We hope to make some preliminary measurements from the recorded data to try and the nature of earthquakes in the region. Understanding the small earthquakes may be key to understanding the big one that happens in the future. We will also deploy further seismometers on the seabed. I’ll be part of a team led by Chief Scientists Anne Trehu from Oregon State University and Dean Livelybrooks from the University of Oregon.  In total, over the three weeks, we have 45 ocean bottom seismometers to deploy and decommission, so we going to be working around the clock to stick to schedule.
Picture
Map showing our cruise plan. The orange and black circles are ocean bottom seismometer sites that need to have instruments deployed / decommissioned. Our deepest ocean seismometer will be placed some 4000 m (1300 ft) below sea level and our furthest seismometer lies 350 km (220 mi) from the nearest piece of coastline.
I would be lying if I said I wasn't nervous. I have very little experiencing of travelling at sea, let alone working at sea. Seasickness could be a huge concern for me. This trip will be a big challenge and I'm sure there'll be some hiccups along the way. Nevertheless, it will be a great experience and a good chance to learn a new method of studying earthquakes.

I will try to keep you informed of our progress by using this blog and Google Maps I will also be regularly posting mini-updates to Twitter.
0 Comments

    Tectonic Debates


    About

    This blog focusses on a wide range of aspects in earthquake science including earth structure, induced seismicity and hazard communication.

    Archives

    April 2017
    March 2017
    September 2014
    April 2014
    February 2014

    Categories

    All
    Africa
    Botswana
    Cascadia
    Cascadia Initiative
    Doublet
    Earthquake
    Earthquake Early Warning
    Earthquakes
    Episodic Tremor And Slip
    ETS
    Japan
    Kaikoura
    Mexico
    New Zealand
    Ocean Bottom Seismometer
    Pacific Northwest
    Philippines
    Science Communication
    Seismic Hazard
    Slow Slip Events
    Tsunami

    RSS Feed

Powered by Create your own unique website with customizable templates.