Stephen Hicks | Seismologist
  • Home
  • Research
    • Imaging fluids in the Caribbean subduction zone
    • Mantle flow in a subduction zone
    • Structure of a subduction megathrust
    • Earthquake sources
    • Full waveform earthquake simulations
  • Communicating science
    • Journal Articles
    • Conference Presentations
    • In the Media
    • International Seismology Day
  • Blog: Tectonic Debates
  • Earthquake Resources
    • Animations
    • Recent Earthquake Teachable Moments
    • UK Moment Tensor Solutions >
      • M4.3 Jersey, Channel Islands - 11 July 2014
      • M4.1Bristol Channel - 20 Feb 2014
      • M4.2 Ramsgate, Kent - 22 May 2015
    • Technical notes
  • CV
  • Get In Touch

Earthquake sequence in Central Chile: what we know so far

25/4/2017

10 Comments

 
I was asked to provide some written comment to a Chilean newspaper, so I thought I'd take this opportunity to write a blog post about the current seismic events offshore of Valparaiso, Chile.

Seismic swarm

There was a clear sequence of seismic events that led up to last night's M6.9 earthquake.
 
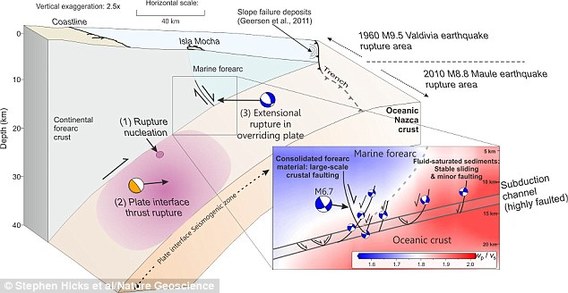
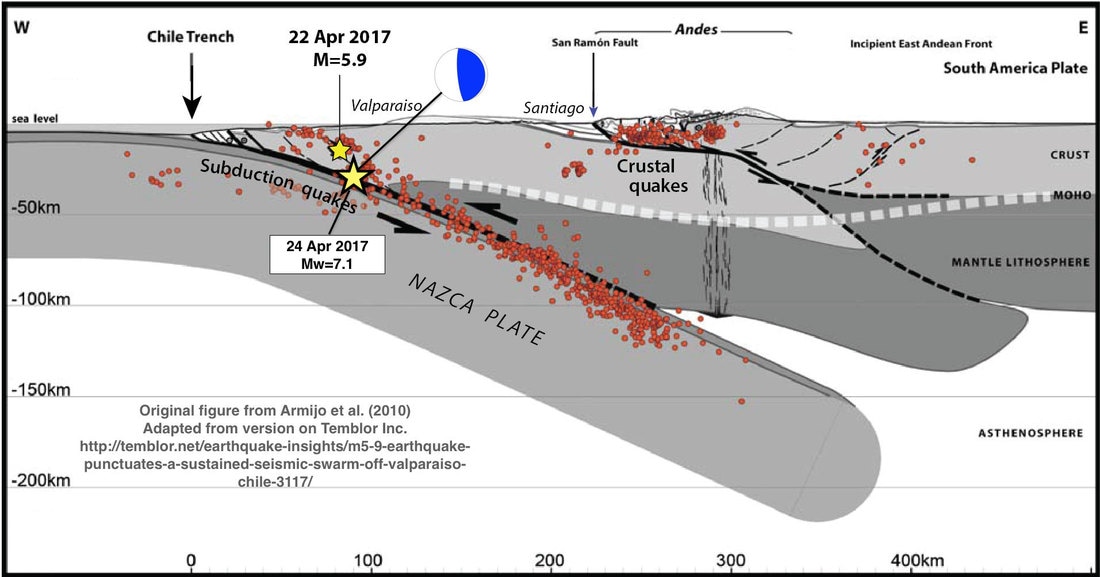
The first event of this seismic sequence occurred on 22 April with a magnitude 4.9 quake. The following day, there were many more small and moderate sized events, including a M5.9 quake. We call this sequence a seismic swarm because it contained many similar sized events occurring in the same location and within a short time of each other. There is some indication a number of these events may have occurred on splay faults that branch from the main subduction fault (see cross-section below).
Picture
Cross-section through the central Chile subduction zone. Red circles give the location of small past earthquakes. The yellow stars give the location of the 2017 foreshock and mainshock earthquakes. Original figure from Armijo et al. (2010).
Eventually, this swarm seems to have culminated (for now, at least) with the M6.9 earthquake that occurred yesterday evening; this is by far the strongest earthquake of the sequence so far. Preliminary data shows that this earthquake may have ruptured the megathrust plate boundary between the Nazca and South American plates. This type of faulting mechanism is responsible for some of the world's largest earthquakes.

Knowing what we do now, we can classify the earlier sequence as a 
foreshock swarm of the M6.9 earthquake. Naturally, this earthquake will have its own aftershock sequence. The largest aftershock so far has been a magnitude 5.4 earthquake that occurred just ~30 minutes after the mainshock. As part of ‘normal’ aftershock sequences, we can expect events as large as around 1 unit of magnitude less than the mainshock (i.e. M5.9-6). The most likely scenario for the near future is that the aftershock rate will gradually decrease with time. However, we cannot rule out the possibility of more, similarly strong, or even stronger events.

Historical precedence

The characteristics of this sequence are fairly similar to what occurred during the seismic sequence that led to the M8.2 Pisagua / Iquique earthquake in northern Chile in 2014. In the 2014 case, the foreshock sequence lasted weeks to months, whereas so far, it seems the Valparaiso sequence lasted a matter of just days. It is possible that this type of behaviour is somewhat characteristic of large earthquakes along the Chile subduction zone. Even the 1960 M9.5 Valdivia earthquake (the largest earthquake ever recorded) had large foreshocks that preceded it in the same area in the days before.

The last strong earthquake in the Valparaiso region occurred in 1985 (magnitude 7.8). Scientific studies have shown that this 1985 earthquake had its own intense foreshock sequence. Going back even further in time, earthquakes in this region typically occur every 75-90 years (see the graph to the right).
Picture
Past large earthquakes along the central Chile subduction zone. Original figure from Comte et al. (1985) and updated to include large ruptures since 1985. This figure shows that possible 'seismic gaps' still lie to the north and south of the April 2017 Valparaiso earthquake.
The April 2017 earthquake doesn’t seem to fit this apparently regular pattern. This discrepancy may be due to several factors: the low sample size of historical events, the little detail on magnitudes of ancient earthquakes, and a possible lack of data on moderate to large magnitude events that were of a similar size to yesterday’s quake.

Outlook

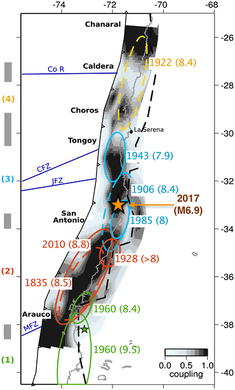
Overall, as yesterday’s event and the past history continues to tell us that the central Chile subduction plate boundary is very active and the region has a very high seismic hazard. We also know that the subduction megathrust fault offshore of Valparaiso is highly locked and may have the potential to host a M>7.5 earthquake in the future. There are still possible 'seismic gaps' to the north and south of the April 2017 Valparaiso earthquake. The map to the right shows the high degree of fault coupling in the area of the 2017 earthquake. 

​With the nearby population centres of Valparaiso and Santiago, earthquakes in this part of Chile have the potential to produce significant damage. 

​We can be sure though that our seismologist colleagues at the CSN (Centro Sismológico Nacional, Universidad de Chile) will be working very hard to inform the local public of any further developments in this current seismic sequence.
Picture
Distribution of fault coupling along the central Chile subduction zone. Darker shading indicates parts of the fault that are more strongly coupled. Map from Metois et al. (2012).
10 Comments

Live video highlights hazard posed by earthquake doublets

8/4/2017

1 Comment

 
I came across a video from 8th April 2017 of a live news report being filmed whilst an earthquake strikes in the Philippines. Videos of news broadcasts whilst earthquakes strike are not rare. During the video, two periods of shaking are experienced, one minute and 30 seconds apart in time. Originally, I thought that the initial shaking was caused by the arrival of the weaker P-waves, whilst the second arrival was caused by the slower-travelling but stronger S- or surface-waves from a single event. Such a long time difference would imply that the earthquake occurred several hundred kilometres away. Due to the dissipation of seismic energy over long distances, it is unlikely that P-waves could be felt so strongly by people.
However, on further inspection, what makes this video so unique is that ​it turns out that the location of the filmed news report was pretty much right at the earthquake's epicentre (up to 5 km [3 miles] away). Even more intriguing is that not only one earthquake occurred, but actually, two separate earthquakes struck.

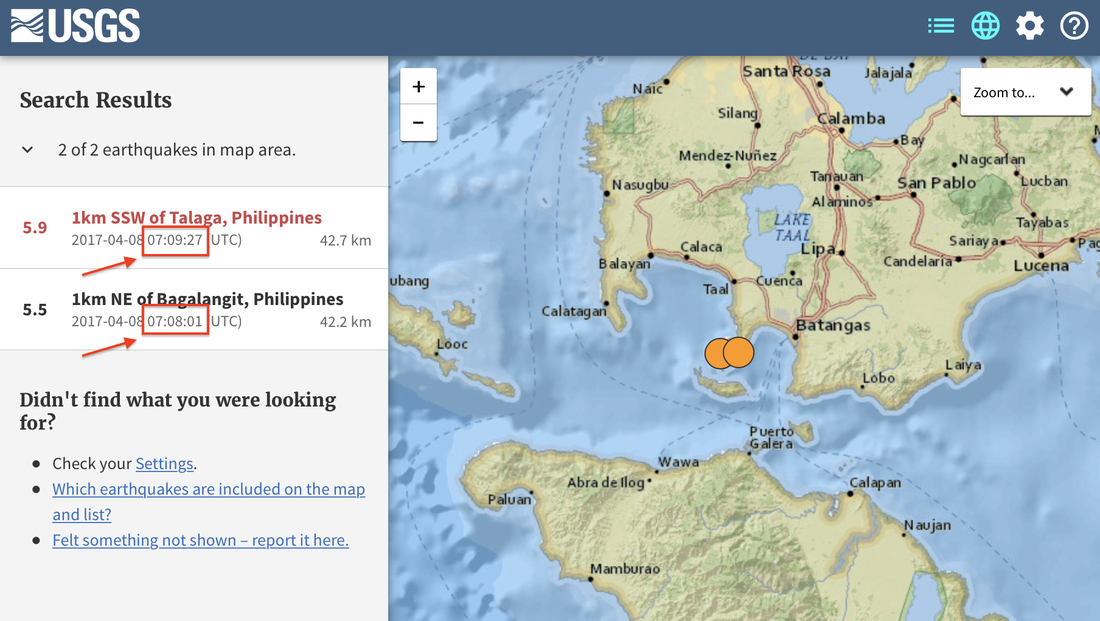
A quick search of the USGS catalogue shows that two earthquakes occurred at the same location, very close to the Port of Batangas. The events struck 1 minute 26 seconds apart. The first quake had a magnitude of 5.5; the second, stronger event had magnitude 5.9. According to the USGS, the first event caused a maximum shaking intensity of Level 5 (moderate shaking), whereas the second stronger quake resulted in shaking intensity of Level 7 (very strong). You can see this difference in shaking intensities in the video (for a description of the different levels of shaking, see this page). So far, there are no reports of significant casualties caused by these earthquakes.
Picture
Screenshot of the USGS catalogue showing the times and locations of the two earthquakes which hit the Philippines on 08/04/17
With a re-watch of the video, you can hear screams from the first round of shaking at 0:53; screams from the second are heard at 2:22. This gives a time difference of 1 minute 29 seconds; this corresponds almost exactly to the time difference between the two earthquake origin times given by the USGS locations.
Picture
Screams from the first round of shaking can be heard from 0:53
Picture
Louder screams from the second round of shaking (more intense) are first heard at 2:22
For the purpose of this post, I am setting forth that magnitude 5.5 and 5.9 can be considered to be 'of a similar size'. With their similar magnitude and because the two events occurred in the same location and within a short time of each other,  we call them an earthquake doublet (alternatively, some seismologists may consider the M5.5 event to be a foreshock of the M5.9 quake).
Doublet earthquakes are incredibly important from a seismic hazard point of view because they lengthen the overall time of ground shaking. Already weakened buildings could become damaged further, possibly leading to structural collapses. Furthermore, doublet earthquakes (particularly where the second earthquake is a similar size or slightly smaller than the first event) present a real challenge to real-time seismic warning systems. Where the second event is the same size or smaller, and when the two events are very closely spaced in space (e.g. less than 10 km apart) and in time (e.g. less than 30 seconds apart), the second event may be hidden inside the series of waves from the first event. 
Past studies have ​shown that stress changes causing doublet earthquakes may trigger large tsunamis. In fact, my own research [#ShamelessSelfPromotion] shows that doublets can occur within only 10 seconds of each other and within very short distances (under 30 km). The doublet that I studied comprised rupture on an underwater fault at shallow depth, which could have potentially caused a locally damaging tsunami. In this case, the doublet may have been completely concealed from global earthquake monitoring systems.
Picture
Final interpretation from my study of a magnitude 7 doublet in southern Chile
From a scientific viewpoint, doublet earthquakes are interesting because they demonstrate that stresses caused by the first quake were probably enough to have helped push another part of the fault, or a completely separate fault, closer to failure, triggering a second rupture. Triggering may be caused by the transfer of stress to surrounding rocks due to physical movement along the fault (called static stress or coulomb stress triggering). Alternatively, triggering may be due to energetic S-waves radiating from the first event shaking up adjacent faults. Static stress triggering occurs over longer timescales (from hours and days to years and decades). On the other hand, dynamic triggering relates to the speed of high amplitude S-waves - typically a few seconds to tens of seconds. In the case of the Philippines doublet, it is possible that both static and dynamic processes were at play. More research and higher resolution studies will be needed to find the exact processes responsible for this doublet. What we do know though is that the second fault must have been already close to failure and was simply 'pushed over the edge'.
Fortunately, the 8 April 2017 Philippines doublet occurred at a relatively deep depth of 42 km (26 miles). Had these events been much shallower, then the shaking intensities could have been much higher, possibly leading to collapsing masonry and structures. Also, because the second earthquake fortunately was the larger event, people were already alert and in the right place. 

Aside from the science of this earthquake, it is interesting to see the reaction of the people to the shaking in this video (apart from those who hid under the transit structure). First and foremost, the reporter maintains excellent composure. More importantly though, in my opinion, the people in the video respond well to the shaking. There isn't too much panic, people steadily move away from structures that could fall, and many people crouch down to ensure that they keep their feet steady and do not fall over. The reaction of people in this video highlights how people in the Philippines are accustomed to feeling strong earthquakes, which occur all too often in the country. In fact, the same area in the video was hit by a magnitude 5.1 earthquake four days earlier. Perhaps this event could be classed as the true foreshock ...
1 Comment

Rupture along a billion-year-old plate boundary in Botswana?

4/4/2017

53 Comments


Largest earthquake to hit Africa for 11 years

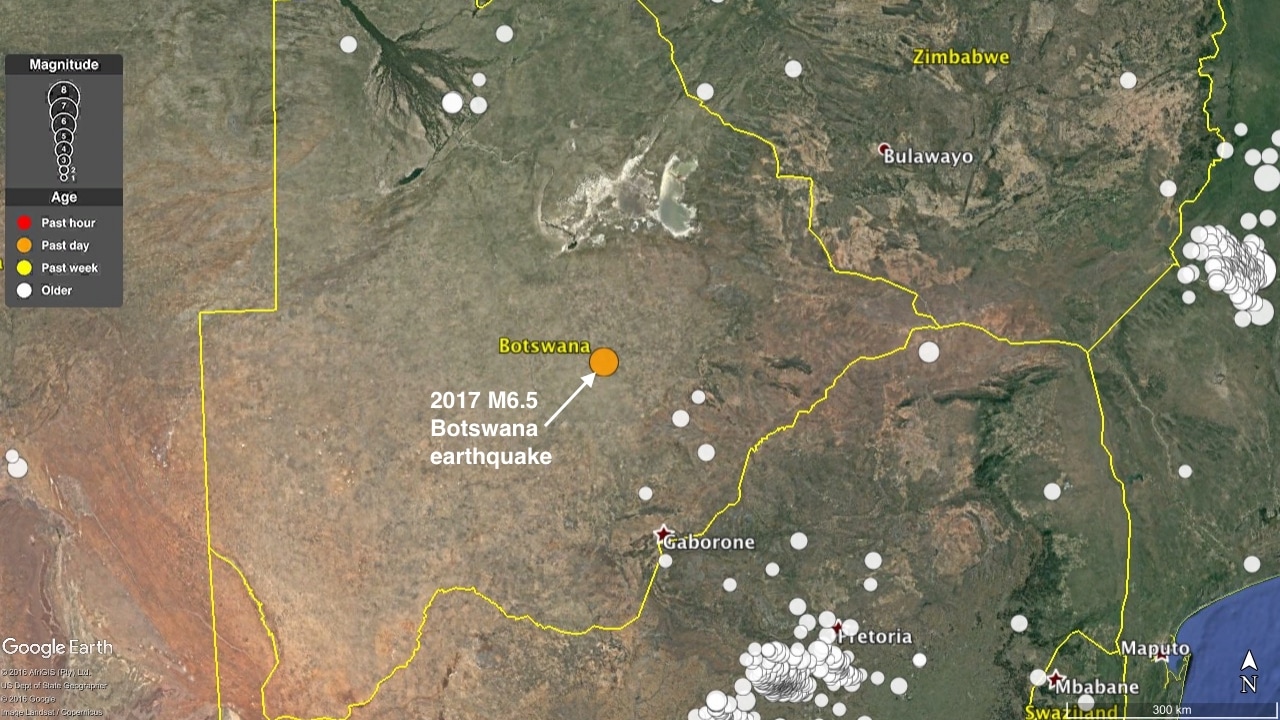
On Monday 4 April 2017 at 17:40 UTC, a magnitude 6.5 earthquake struck in central Botswana, Africa. The rupture occurred at an approximate depth of 30 km (19 miles). Very strong shaking (Intensity 7) was felt close to the epicentre and weak shaking (Intensity 3) was reported 500 km away in Johannesburg, South Africa. This earthquake is the largest to have struck mainland South Africa for over eleven years.
Picture
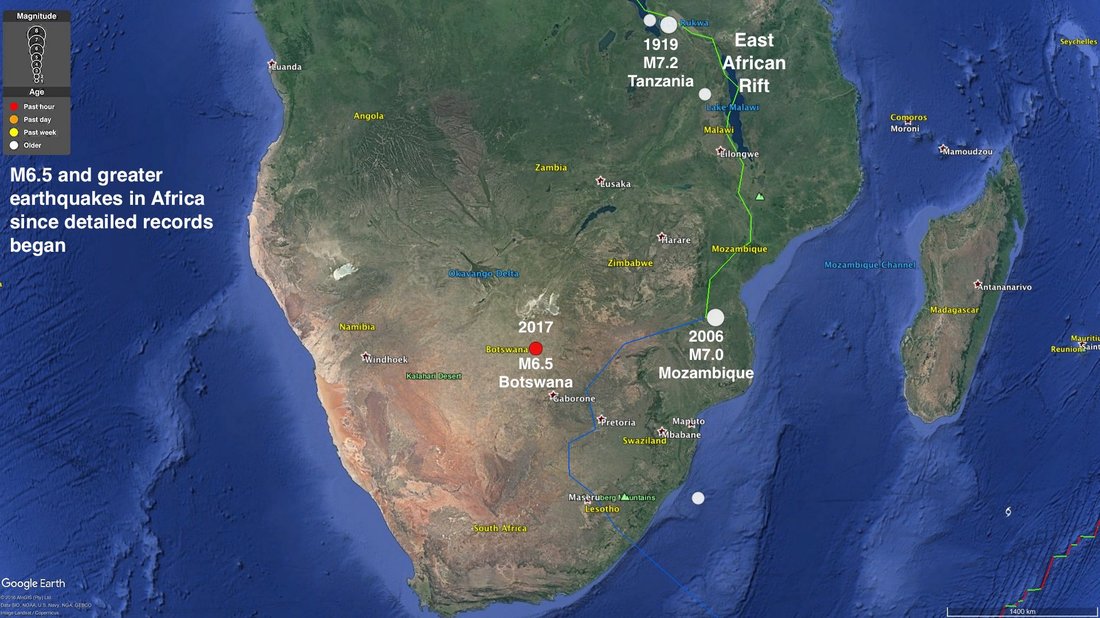
Map showing earthquakes of magnitude 6.5 and greater that have occurred in Southern Africa since detailed records began (1900 onwards).
The largest earthquakes in southern Africa are concentrated in the eastern countries of Tanzania, Malawi, and Mozambique, where the continent is slowly pulling apart (rifting) in an east-west orientation. This rifting forms the boundary between the Nubian and Somali plates (part of the larger African plate) and results in normal faulting earthquakes. For example, the 2006 magnitude 7.0 Mozambique earthquake, which caused several fatalities, was a normal faulting earthquake, which ruptured the southern end of the East African Rift.

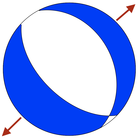
The April 2017 Botswana event is also classified as a normal faulting earthquake, yet its focal mechanism, which shows the orientation of extension, is approximately perpendicular to the East African rift. Therefore, a different geological structure, which may somehow be broadly related to the East African rift, may have been responsible for this earthquake.

Earthquakes in Botswana are extremely rare. Given that this event has occurred over 1000 km from the nearest tectonic plate boundary, we call these types of events '
intraplate earthquakes'. It is likely that the rupture occurred partly due to the gradual transfer of push and pull stresses from the East African Rift toward the more stable part of the continent. Occasionally, this stress is released along pre-existing weaknesses in Earth's crust as earthquakes. It is fundamentally the same reason why quakes occasionally occur in other stable regions such as the United Kingdom and the midwestern states of North America.
Picture
Picture
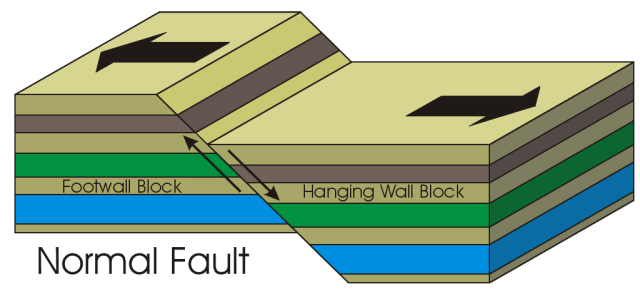
Top: Focal mechanism ('beach-ball') for the Botswana earthquake indicating extension in anortheast-southwest direction. Bottom: schematic block diagram showing sense of crustal movement during normal faulting.
PictureRecorded earthquakes in Botswana from the USGS catalogue

As with all earthquakes, there will be some aftershocks of this rupture. From the nearest real-time seismometer station located ~270 km away from the epicentre, smaller-sized aftershocks can be clearly seen occurring in the hours ensuing after the mainshock.

Two aftershocks have been recorded by Germany's GEOFON monitoring system. One of these aftershocks had a magnitude of 4.6; the other magnitude 4.1.

Based on Bath's aftershock law, it is plausible to expect aftershocks as large as magnitude 5.4.

A quick interpretation of the Lobatse seismograph showing the #botswana #earthquake & its aftershocks @ALomaxNet @seismo_steve @LastQuake pic.twitter.com/qtCKRMjATk

— J H Gurney (@UKEQ_Bulletin) April 3, 2017

Possible complexity in the rupture

Early estimates of the earthquake's depth suggest that it occurred deep within the continent (in the mid-lower crust). Therefore, there is likely to be very little data available from possible surface ruptures.
​
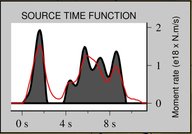
When a large global earthquake occurs, the GEOSCOPE seismic observatory, based at IPGP in Paris, automatically calculate rupture 'source-time functions'. These graphs show how the amount of energy released by the earthquake changes during the rupture.
The GEOSCOPE solution (right) shows at least two distinct peaks in energy release, possibly indicating that the earthquake was composed of multiple, distinct ruptures.
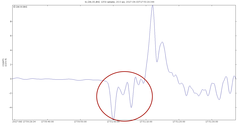
This complex source time function can also be seen from the rare seismic waveforms from distant stations.
Picture
Multiple peaks in the rupture function indicate multiple fault ruptures. Source: Geoscope / IPGP (http://geoscope.ipgp.fr)

@seismo_steve @UKEQ_Bulletin Here station GNI at 65deg - seems to agree with SCARDEC: some complexity in an ~10s rupture. https://t.co/ASQY70IflJ https://t.co/fYullzbKfG pic.twitter.com/todwide5eg

— Anthony Lomax □ (@ALomaxNet) April 3, 2017
Picture
Displacement seismic waveforms from a recording station in Armenia. Some complexity within the first 10 seconds of rupture (circled) can be seen.

Stresses from Eastern Africa?

The central and western areas of Southern Africa are assumed to be tectonically very stable. The geology of the region is typically referred to as the 'Kaapvaal Craton'. Craton means a strong region of a continental tectonic plate that are typically stable for over a billion years. The Kaapvaal Craton contains rocks that are 3.6 to 2.5 billion years old. Large earthquakes in such stable tectonic environments occur very rarely.

A large quake in Botswana is puzzling because it is made of Proterozoic and Archean rocks, the oldest and generally most stable on Earth

— Caroline Beghein (@caro_aniso) April 4, 2017
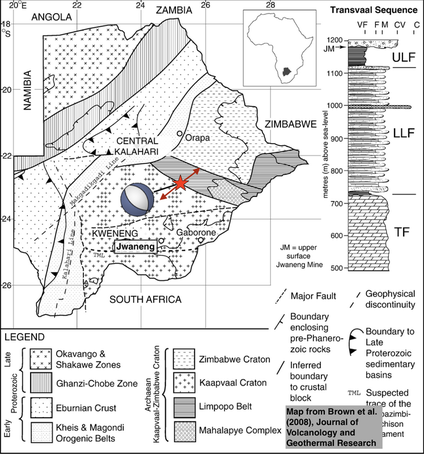
Comparing the location and mechanism of the Botswana earthquake with a regional geological map reveals that the earthquake's epicentre may have occurred close to the boundary between Kaapvaal rocks and those of the Limpopo Belt - a distinct group of metamorphosed rocks with a slightly younger age of ~1.8 billion years old. This may simply just be a coincidence. Furthermore, given the lack of nearby seismic stations, this exact location may be uncertain. Nevertheless, it is worth considering what implications such a relationship may have.
Picture
2017 Botswana earthquake epicentre (red star) together with focal mechanism (blue beach ball) plotted on a regional geological map from Brown et al. (2008). The red arrows indicate the direction of horizontal extension during the earthquake.
Dr Eddie Dempsey is a geologist from the University of Durham; he specialises in analysing the structure of rocks that have been deformed deep within the crust. He agrees that there may be an influence on the stresses and resulting strains caused by rifting in East Africa. Stress may eventually be released along old but relatively weak tectonic suture zones to form occasional quakes like the Botswana event. Such old cratonic rocks, however, are typically very layered (high seismic anisotropy), which may complicate our analyses of this quake using seismic waves.

@EC_Kosters @SeismoSue @seismo_steve But this may also be purely coincidental. The lack of nearby seismic stations together complexity of the African crustal anisotropies make

— tectonictweets (@tectonictweets) April 4, 2017

@EC_Kosters @SeismoSue @seismo_steve The orientation of the focal mech is consistent with the regional fabric so there may be reactivation of ancient basement structures

— tectonictweets (@tectonictweets) April 4, 2017

Re-activation of an ancient tectonic boundary?

One research paper from the 1980s studied the nature of the geological contact between Kaapvaal and Limpopo further to the east in South Africa. Based on small changes in gravity across the two groups of rocks, the study interpreted that this geological contact demarcates an ancient (pre-Cambrian) plate boundary between two colliding plates.
Is it therefore possible that the inherent weakness of this ancient, billion-year-old plate boundary ruptured during the 2017 Botswana earthquake? Whilst the craton as a whole stands strong, discrete weak points could still be exploited by shifting tectonic stresses.  Yet our first estimates of the earthquake's location are somewhat uncertain; therefore, much more research including on-the-ground field studies, as well as analysis of satellite and geophysical data will be needed in the next few months to better answer this question.
What we do know though is that earthquakes caused by intraplate deformation will always be surprising to us; they have the potential to produce very large and damaging earthquakes. Dr Susan Hough, a seismologist at the United States Geological Survey says that stable continental crust may occasionally produce earthquakes as large as magnitude 7.5. 

@caro_aniso Magnitude 7 or maybe 7.5 is a typical Mmax estimated for "stable continental crust."

— Susan Hough (@SeismoSue) April 4, 2017
Everyone around the world, even those living in the most stable tectonic areas, should try to familiarise themselves with some simple procedures to follow if they experience shaking caused by an earthquake should the unexpected ever occur.

Update 1 (05/04): Interplay between tectonics and earthquake activity in southern Africa

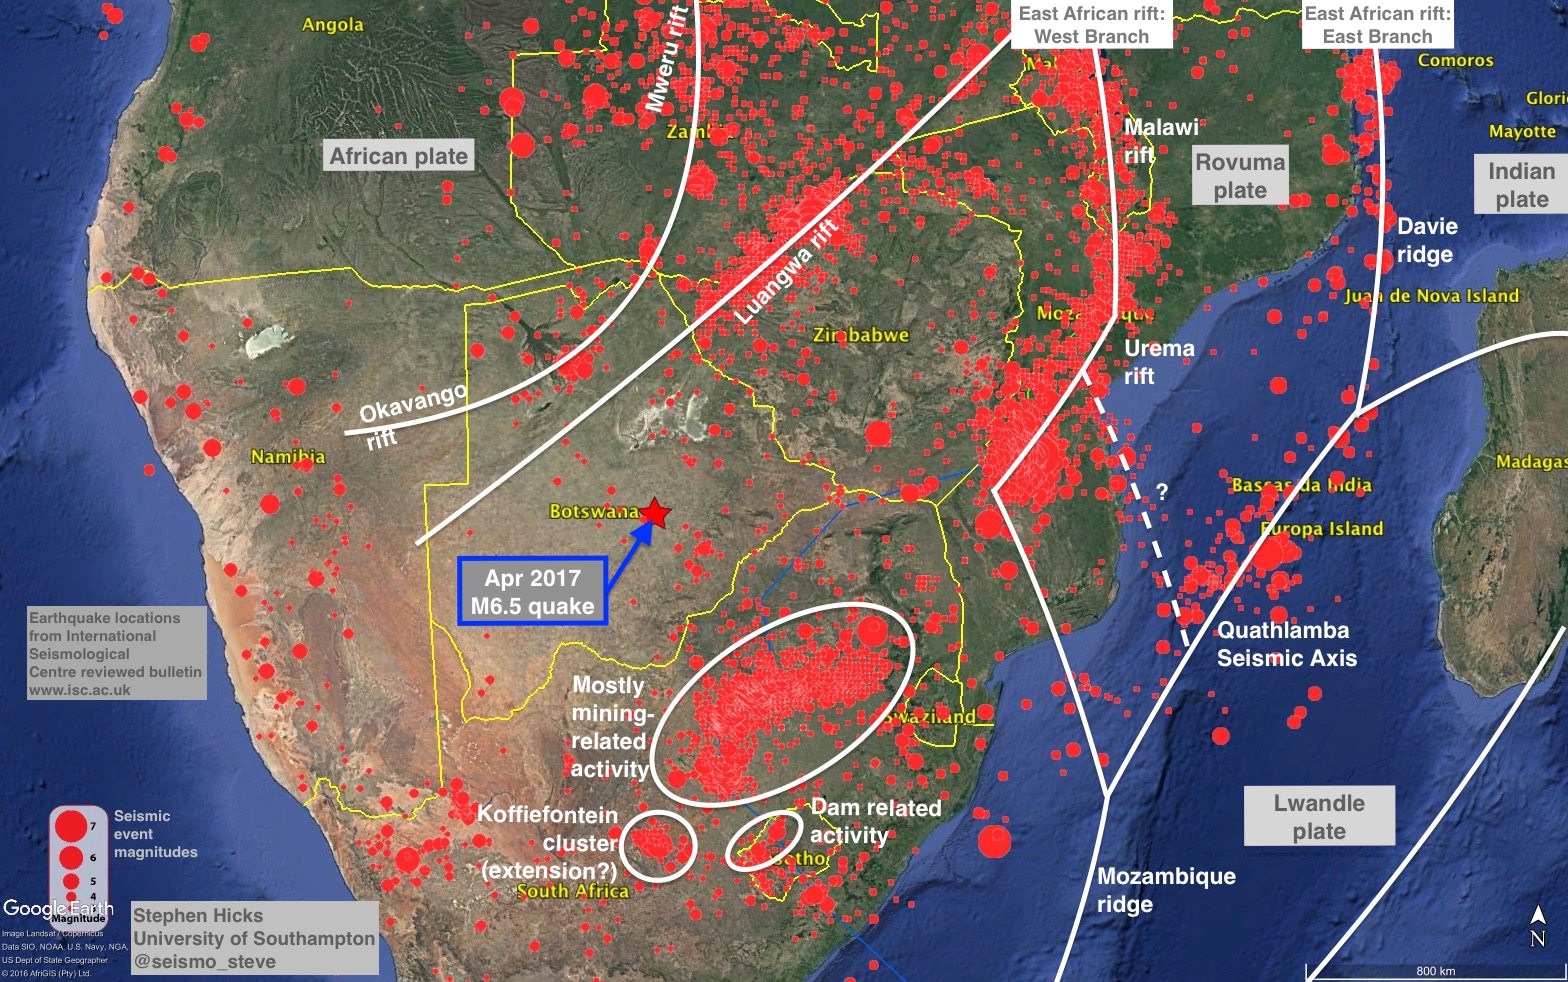
I have made a quick map showing the distribution of ridges, rifts and micro-plates in Southern Africa and how these relate to earthquake activity in the region. Overall, the picture is very complicated but shows the main network of structures that may have contributed to the Botswana earthquake.
Picture

Update 2​: Gravity sheds light on the possible fault(s) that ruptured

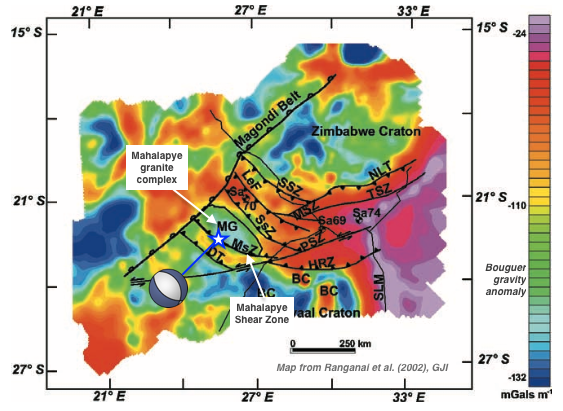
I have found a research paper from 2002 written by Ranganai et al. that maps small changes in gravity over south-eastern Botswana to interpret the location of ancient geological provinces and faults.

The April 2017 earthquake occurred in a highly deformed region separating the Kaapvaal Craton from the Zimbabwe Craton. The paper calls this region the Limpopo–Shashe Belt. This belt is composed of many northwest-southeast trending shear zones and reverse (thrust) faults that were formed as the Kaapvaal and Zimbabwe cratons slammed into each other billions of years ago (during the Archean eon). The authors speculate that this collision might have been similar to the same mountain building process that has resulted in the present-day Himalayan chain.

As the map shows below, the Mahalapye Shear Zone may be related to the fault that ruptured in April 2017. The orientation of the fault is parallel to the orientation of the focal mechanism. However, the rupture was extensional - not compressional like the mapped fault. Therefore, it is possible that the regional extensional rift tectonics in Southern Africa have reverse the sense of motion of these faults in a so-called stress inversion.
Picture
Gravity map of the southeastern Botswana region overlain with interpreted fault locations and the 2017 Botswana earthquake. Gravity map comes from Ranganai et al. (2002).
​With the possible complexity of this earthquake that was suggested by the early data, it is possible that more than one of these closely-spaced faults ruptured during the magnitude 6.5 earthquake. More detailed analysis will be needed to look at this possible scenario.

Further information
  • Earthquake Report from Dr. Jay Patton
  • USGS earthquake page
  • EMSC earthquake page
  • UC Berkeley Seismo Blog
53 Comments

    Tectonic Debates


    About

    This blog focusses on a wide range of aspects in earthquake science including earth structure, induced seismicity and hazard communication.

    Archives

    April 2017
    March 2017
    September 2014
    April 2014
    February 2014

    Categories

    All
    Africa
    Botswana
    Cascadia
    Cascadia Initiative
    Doublet
    Earthquake
    Earthquake Early Warning
    Earthquakes
    Episodic Tremor And Slip
    ETS
    Japan
    Kaikoura
    Mexico
    New Zealand
    Ocean Bottom Seismometer
    Pacific Northwest
    Philippines
    Science Communication
    Seismic Hazard
    Slow Slip Events
    Tsunami

    RSS Feed

Powered by Create your own unique website with customizable templates.